
LanguageCert Academic vs IELTS Exam Guide for Study and Visa
LanguageCert Academic is an English language test used for higher education and visa purposes, and it’s often …

A LanguageCert score chart explains how your English skills are measured across listening, reading, writing, and speaking, then aligned to CEFR levels. Universities and visa officers use it to judge your language proficiency score clearly. When you’re comparing exams, the chart also shows how LanguageCert Academic results sit alongside IELTS bands.
So, why does this matter? I see students mix up charts from different exams all the time. And that confusion can affect study plans, IELTS preparation choices, and visa timing. Let’s sort it out.
Many students struggle to read a score chart because each exam reports results in its own way. A band, a scale, a CEFR level. Sound familiar? I’ve seen strong test takers panic, not because the exam was hard, but because they didn’t understand the numbers on their report or how those numbers affect an IELTS writing test or LanguageCert test outcome.
Here’s the thing. I’m writing this from the instructor seat. I prepare students for LanguageCert Academic, IELTS, including ielts listening practice and ielts exam speaking test preparation, and visa pathways every week. We’ll break down the language cert score chart, explain the language proficiency score behind it, and compare it with IELTS where it actually matters. Study goals. Visa goals. Real outcomes.
A LanguageCert score chart shows how your performance in an English language test is measured and reported. It includes an overall result, individual skill scores, and a CEFR level from A1 to C2. Simple on paper. Tricky in practice.
You’ll find the languagecert score chart on your languagecert score card after the test. It lists listening, reading, writing, and speaking results, including the language cert score chart speaking section, each mapped to CEFR standards. For LanguageCert Academic, these results confirm readiness for English academic study. For languagecert general, the focus is everyday communication.
Most test takers also see a short qualification overview on the report. This confirms the test version, test centre, and whether the result meets academic or migration needs. And yes, the alignment follows the languagecert global scale, which keeps scores consistent across regions.
Key point. LanguageCert does not use bands like IELTS. It uses scaled results aligned to CEFR.
First, look at each skill score. Listening, reading, writing, and the language cert score chart speaking section are shown separately. This helps institutions judge strengths and weaknesses across the full languagecert academic test.

Next, match the scaled result to the CEFR level. A B2 score means upper-intermediate English language proficiency. A C1 score signals advanced control. Clear once you slow down.
Here’s where students often slip. They assume one low skill fails the whole test. That’s not always true. Some organisations accept mixed profiles. Others don’t. Depends on the rulebook you’re dealing with.
Warning. Don’t compare LanguageCert numbers directly with another exam without checking CEFR alignment or the official languagecert score chart pdf used by the institution.
The languagecert academic test assesses four core skills using an integrated format. Listening and reading are computer-based. Writing is a written exam. Speaking is a live interview with an examiner.
Each skill follows clear language assessment criteria:
Scoring follows international ESOL standards used across languagecert international esol qualifications. Examiners apply set marking guides, including the qualification handbook listening and qualification handbook speaking. That consistency matters for visas and universities.
Honestly? This structure works well for students who want a focused languagecert test and fast results.
Students compare LanguageCert and IELTS scores because both are accepted for study and migration. The challenge is that results are reported differently, especially when students look at an IELTS writing score or ielts listening scoring next to a LanguageCert result.
Both exams align with CEFR levels. IELTS uses bands from 0 to 9. LanguageCert Academic uses scaled scores tied to CEFR. The language proficiency score may look different, but the skill level can be similar.
Before jumping to a table, remember this. No conversion is official. Institutions decide how they read results. Always check entry rules.
| CEFR Level | LanguageCert Academic | IELTS Band (Approximate) |
|---|---|---|
| B1 | Pass at B1 level | 4.0 to 5.0 |
| B2 | Pass at B2 level | 5.5 to 6.5 |
| C1 | Pass at C1 level | 7.0 to 8.0 |
| C2 | Pass at C2 level | 8.5 to 9.0 |
Universities and visa bodies use this table as a guide only. A languagecert score chart pdf or languagecert score card can help you visualise the link, but it’s not a promise. And it never replaces official entry rules.
IELTS listening scoring is based on 40 questions. Each correct answer earns one mark. Your raw score is then converted to a band from 0 to 9.
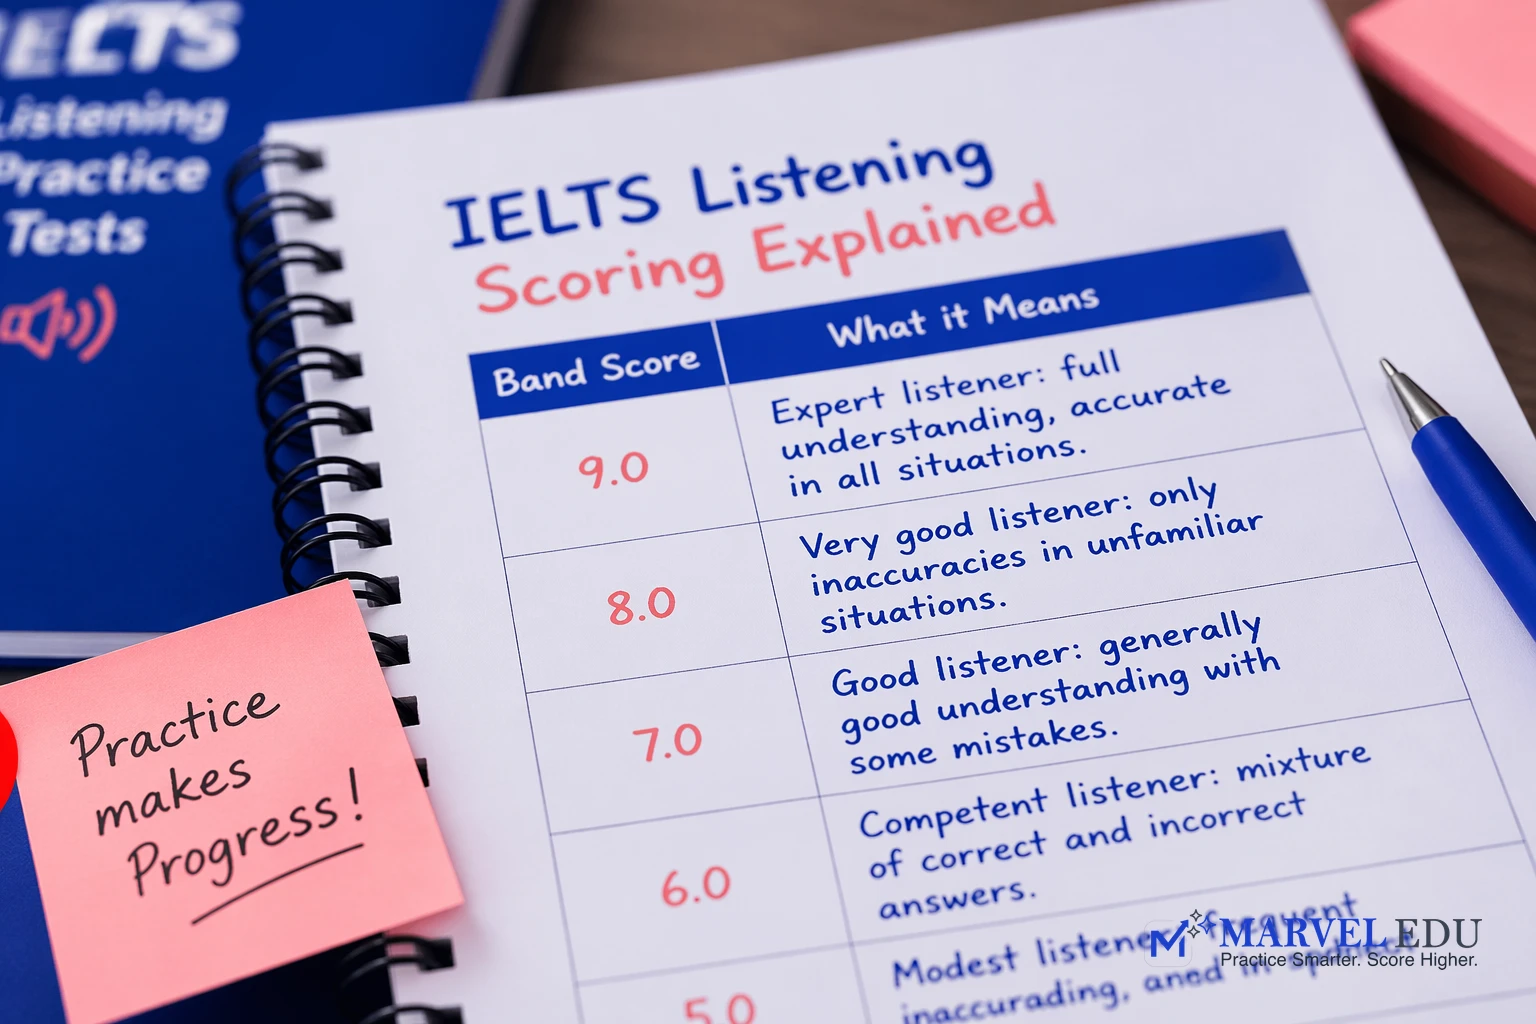
For example, around 30 correct answers usually equals a band 7.0. Exact conversions can vary slightly by test version. That surprises people, honestly.
This is why ielts listening practice matters. Regular ielts exam listening practice trains you to follow accents, predict answers, and manage time on the answer sheet.
Effective IELTS listening preparation often includes:
Practice doesn’t just improve skill. It improves score reliability.
The IELTS writing test includes two tasks. IELTS writing task 1 checks how well you describe data or situations. IELTS writing task 2 assesses your ability to argue a position clearly.
Both tasks use four criteria. Task achievement or response. Coherence and cohesion. Lexical resource. Grammatical range and accuracy. Miss one badly, and the score drops.
Using ielts writing task 1 examples helps you learn structure. Reviewing ielts writing task 2 examples and common ielts writing task 2 topics builds idea control and planning speed. This applies to both ielts academic writing and ielts general writing. But copying templates blindly? Bad move. Examiners spot that fast.
The IELTS speaking test has three parts. An interview. A short talk. Then a discussion. It runs for about 11 to 14 minutes.
Scoring focuses on fluency, coherence, vocabulary, grammar, and pronunciation. IELTS speaking questions change, but the skills don’t. Confidence comes from practice, not memorising answers for the ielts exam speaking test.
Compared with LanguageCert, the speaking style is similar. Both use trained examiners. Both assess real communication. The difference is format and timing, not difficulty.
Visa officers use score charts to judge risk. Universities use them to judge readiness. Same numbers. Different purpose.

In my visa consultancy work, I’ve seen applications delayed because test results were misunderstood. A strong language proficiency score helps. But only if it meets the specific visa rule.
Some pathways accept LanguageCert Academic. Others prefer IELTS or PTE Academic. A few accept the occupational English test. This is why exam choice should follow visa planning, not the other way around.
Choose LanguageCert Academic if you need fast results, flexible scheduling, or a familiar international ESOL format. It suits students working with tight deadlines.
Choose IELTS if your institution asks for it by name or if you need ielts general writing for migration points. Many students prepare for both exams at once. That can work, if done properly.
And yes, languagecert international esol options suit multi-country plans. I’ve seen that play out well.
AI practice tools track performance across each skill. They show patterns humans often miss. Repeated grammar slips. Timing issues. Speaking pauses.
Linking AI feedback to score charts helps you train with purpose. Practising ielts writing task 1 examples or ielts writing task 2 examples becomes targeted, not random.
At Marvel Education Group, our shared platform supports more than 85,000 users across exams. Same AI brain. Different exam paths.
Want to try it? Start practice here: Start Practice
One mistake is confusing CEFR levels with raw marks. Another is assuming automatic score conversion across exams. That never ends well.
Students also ignore institution-specific rules. A score report might look strong but still miss one requirement. I don’t like that approach. Never have.
Always read the full test report. And double-check how results are used.
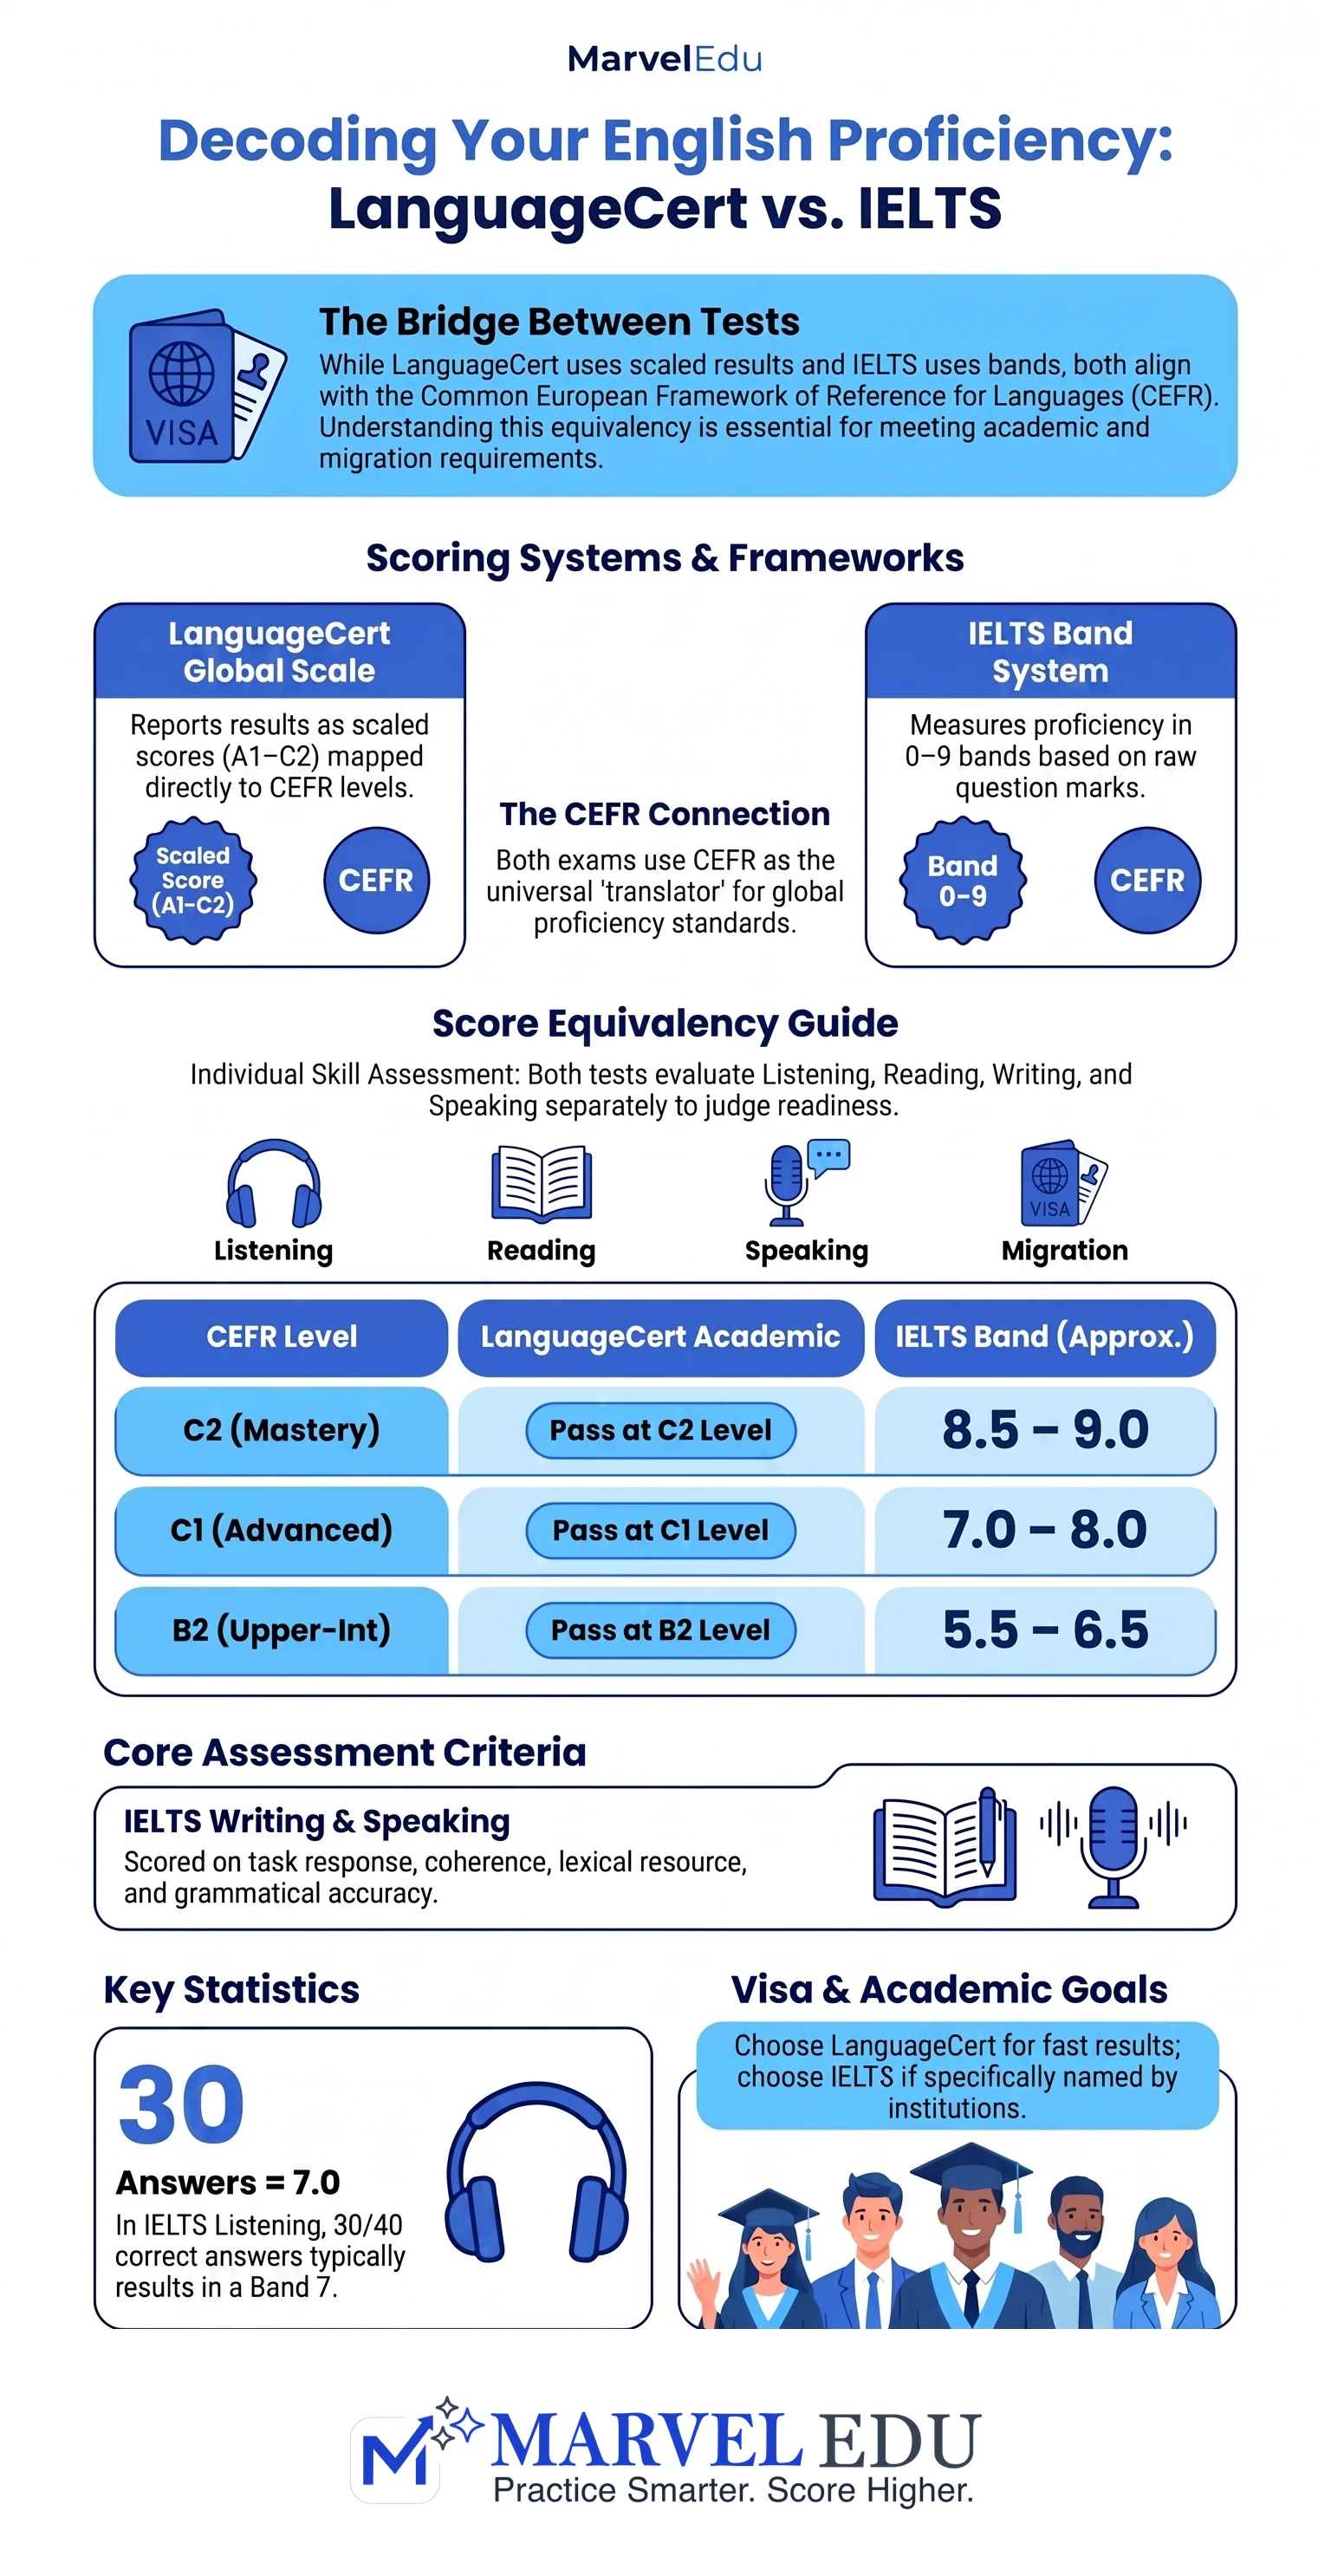
This infographic gives a quick view of CEFR alignment, exam structure, and typical score ranges. It’s useful for revision, sharing, and planning. A handy snapshot for busy students juggling ielts writing task 2 topics, ielts speaking preparation, and visa paperwork.
A LanguageCert score chart shows your results for each skill and the CEFR level achieved. Institutions use it to assess English language proficiency and compare it with other exams.
Yes, many visa pathways accept languagecert academic results. Acceptance depends on the country, visa type, and minimum language proficiency score required.
You can compare them using CEFR alignment and a languagecert score chart. Conversions are indicative only and not official.
Most institutions accept results for two years. Always confirm with the visa or study authority.
Yes. IELTS listening scoring contributes directly to your overall IELTS band score, alongside reading, writing, and speaking.
Understanding a language cert score chart helps you plan smarter. It shows how skills, CEFR levels, and exam results connect to real outcomes. Comparing languagecert academic with IELTS only works when visa and study rules are clear.
From my experience, informed choices reduce stress. They also save time. Marvel Education Group brings exams, AI practice, and visa guidance under one roof. That’s the point.
If you’re ready to map your path, check pricing here: View Pricing. Or speak with our visa consultancy team and get clarity early.
LanguageCert Academic is an English language test used for higher education and visa purposes, and it’s often …

Introduction Many students compare the languagecert academic test with IELTS because both meet an English …

The LanguageCert test is a secure English language test used for study, work, and visa purposes in many …